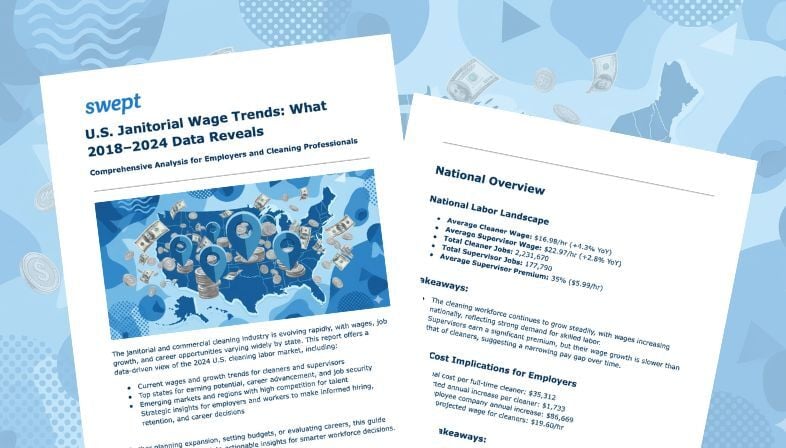


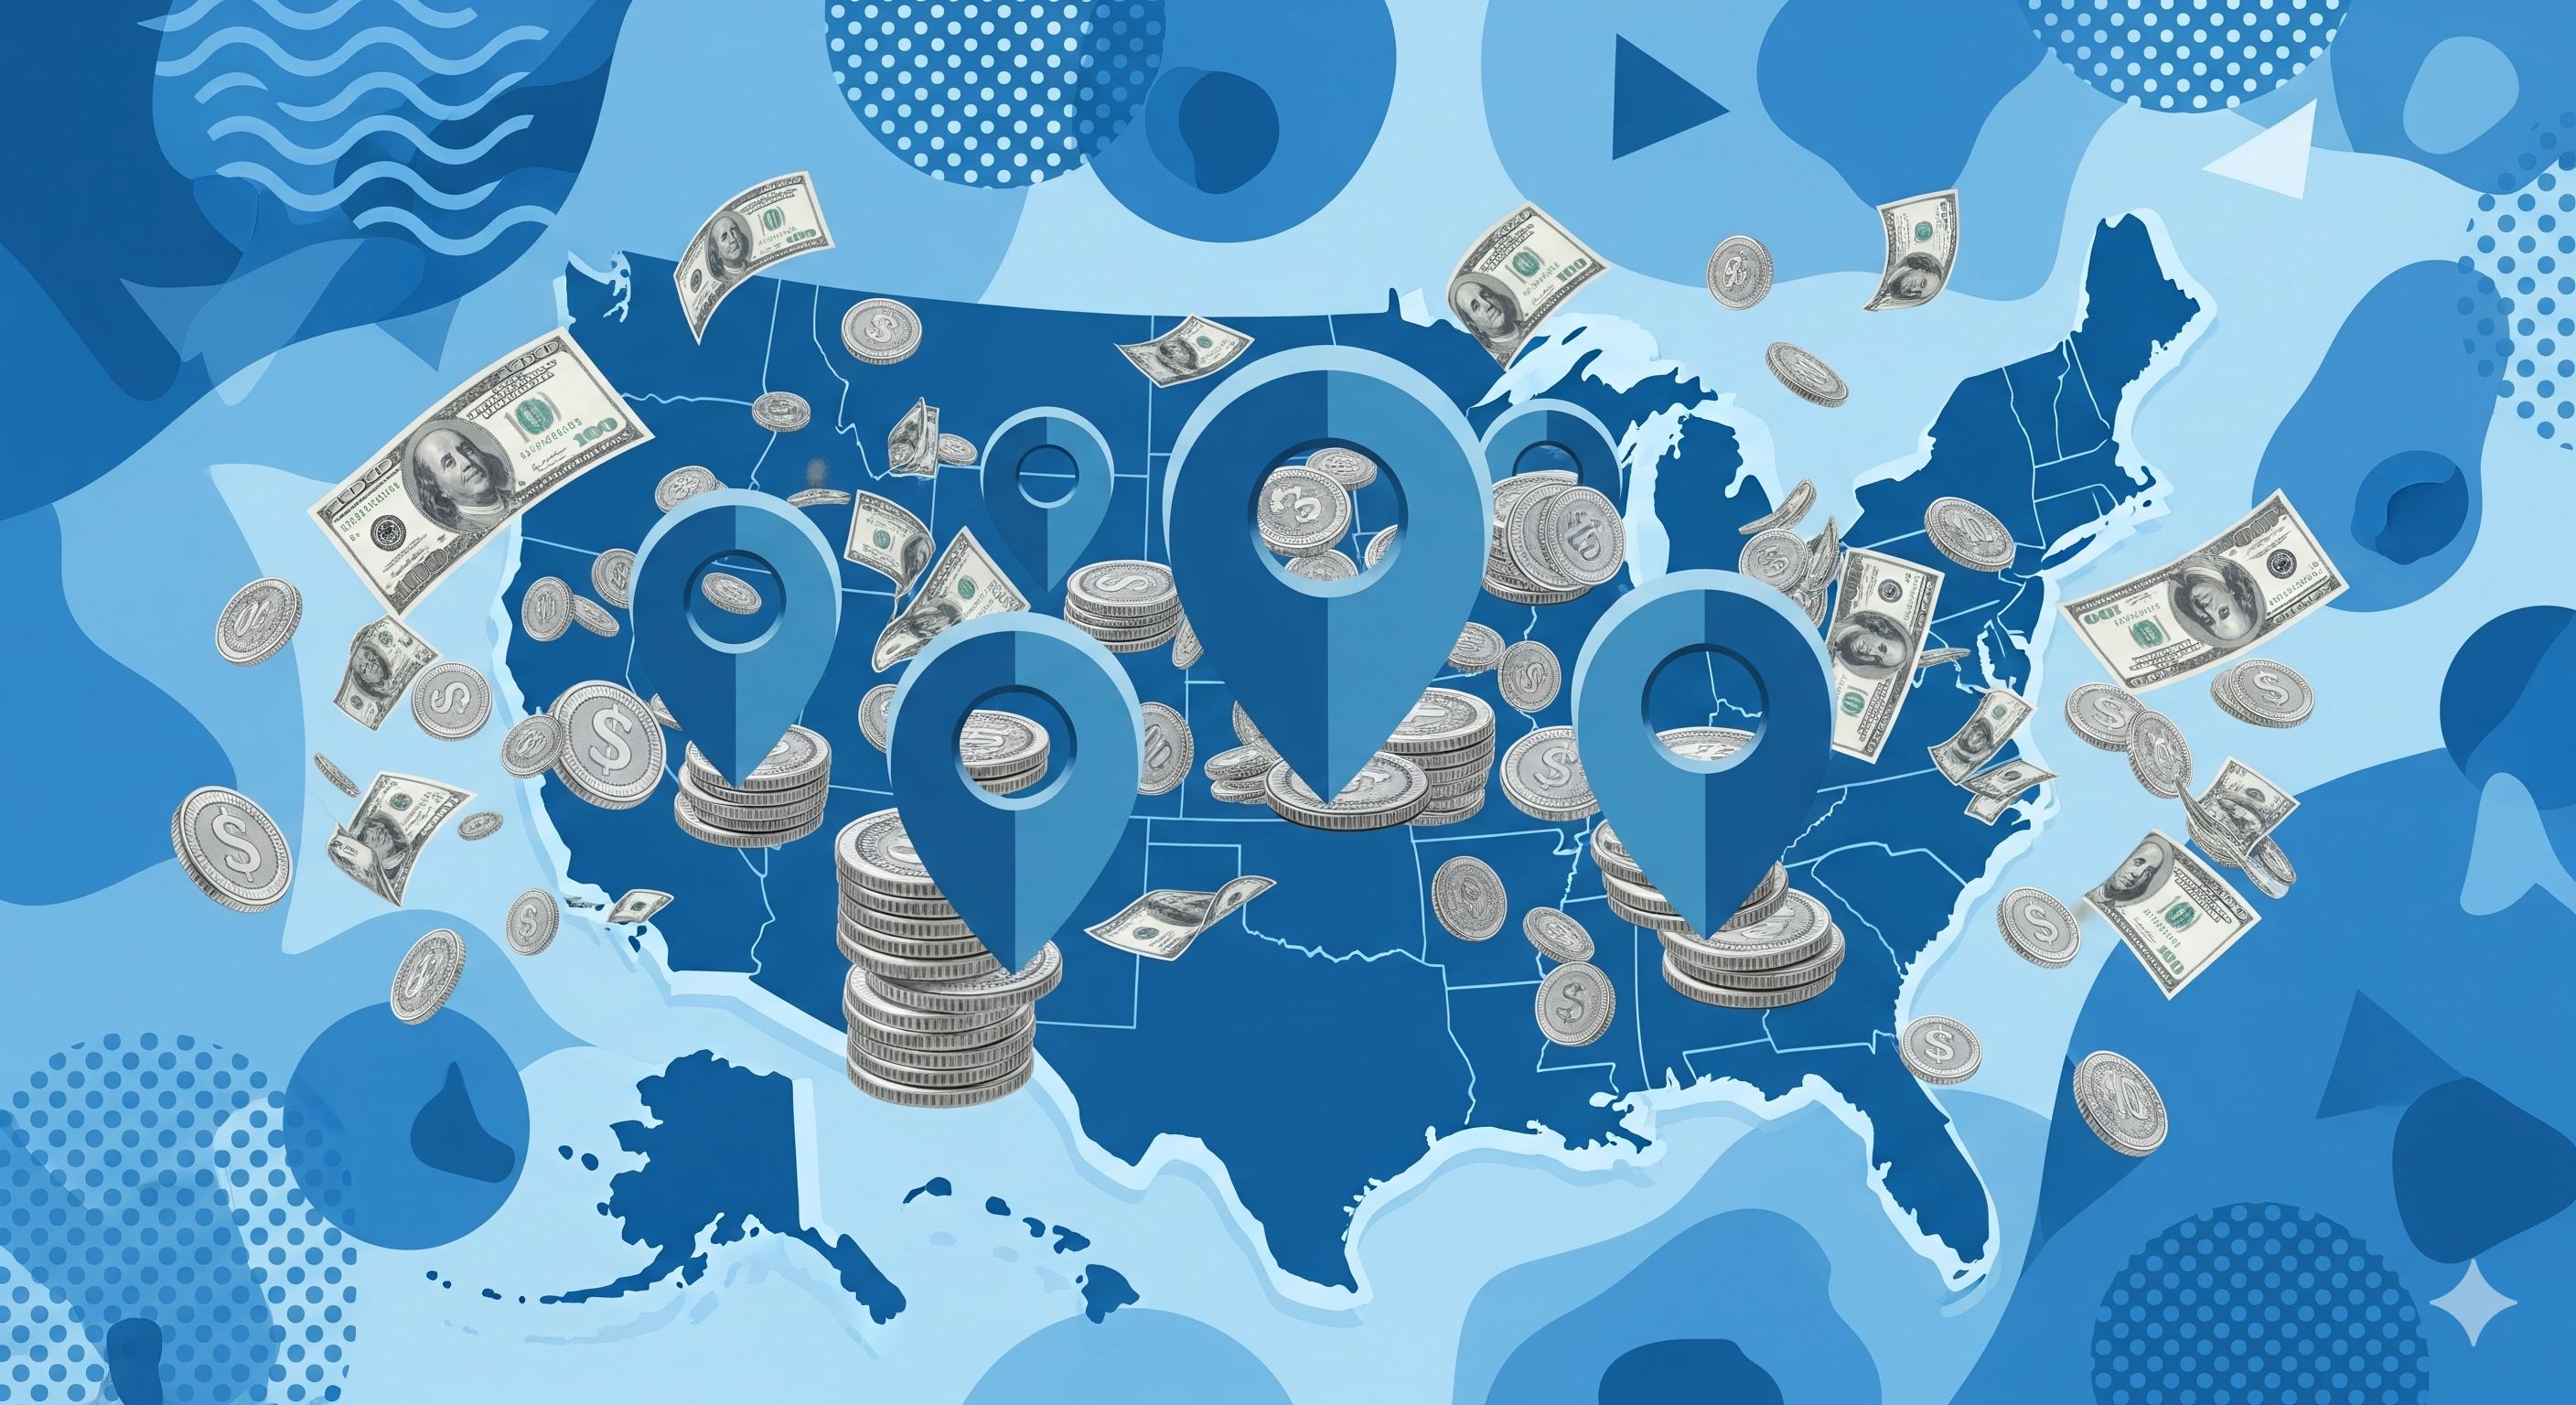
Where Janitors Earn the Most: Cleaner & Supervisor Pay by State
Professional wage analysis for janitors and supervisors across the United States (2019-2024)
Thinking about hiring, budgeting, or planning your next career move? Wages for janitors and supervisors have been shifting fast—and where you live can make a huge difference.
Our analysis of 2.2 million cleaning professionals across all 50 states shows a rapidly changing compensation landscape that's reshaping the industry.

National Wage Averages (2024)
The national median wage is $17.07/hour for cleaners and $23.18/hour for supervisors.
Janitorial wages have risen 4.2% nationally in the past year, with some states seeing increases of 6.9% or more.
That growth isn't slowing down. At this pace, cleaner wages are projected to reach $19.60/hour by 2027 — a 15% jump that could add over $5,200 in annual labor costs per worker.
But here's the twist: cleaner wages are growing nearly twice as fast as supervisor wages (+4.9% vs. +2.6% annually).
That's shrinking the promotion premium in many states, meaning moving up doesn't always come with a big financial reward anymore.
How Does Your State Compare?
Enter your current wages or your state to see detailed comparisons. Our data covers all 50 states plus territories, from US Bureau of Labor Statistics.
🔍 Filter & Compare
State-by-State Breakdown
Comparing top-ranking states for wages and the pay premium supervisors receive.
Wages vary dramatically depending on where you work:
Massachusetts cleaners make $21.43/hour.
Mississippi cleaners earn $13.27/hour.
That's a 61% difference — enough to reshape hiring strategies, career decisions, and even migration patterns.
But the numbers get more interesting when you look beyond today's pay. States like Arizona and Idaho are seeing some of the fastest wage growth in the country (6.9% and 6.5% respectively). Within three years, Arizona cleaners are projected to out-earn California's, even though they start lower today.
Key takeaway: If you're a worker chasing higher pay, watch the fast-risers like AZ, ID, and NM. If you're an employer, plan ahead — today's "affordable" markets may not stay that way for long.
🏆 Top States by Wage & Premium
Ranked by cleaner median wage for 2024
| Rank | State | Cleaner Wage | Supervisor Wage | Premium (%) |
|---|
National Wage Trends (2019-2024)
The national median wage is $17.07/hour for cleaners and $23.18/hour for supervisors.
Cleaner wages have been on a steady climb since 2020, reflecting post-pandemic labor market realities. At the current growth rate, wages could hit $19.60/hour by 2027 — a 15% jump that adds around $5,200 per worker per year for employers.
Supervisor pay, on the other hand, has grown more slowly — just 2.6% annually — suggesting the gap between frontline and management pay is starting to shrink.
What this means for employers: Promotions may feel less financially rewarding, so retaining managers might require better perks, flexibility, or culture-driven incentives.
📈 Cleaner Wage Trends
Median hourly wages for Cleaners/Janitors
📈 Supervisor Wage Trends
Median hourly wages for Supervisors
National Employment Landscape (2024)
There are an estimated 2,194,870 cleaners and 174,150 supervisors employed nationally.
Job growth overall is up 1.3%, but here's the twist: 18 states actually lost cleaners — and many of those are the same states seeing the fastest wage hikes.
This imbalance creates two realities. Employers are facing rising competition for fewer workers, while workers can often secure better pay simply by switching markets.
For example:
Montana has seen +3.4% job growth, creating expanding talent pools. Meanwhile, Hawaii experienced a -4.1% job decline, which could present opportunities for companies to consolidate as competitors leave.
Employers in shrinking labor markets may need to boost pay or benefits to stay competitive. Workers, meanwhile, can leverage these shortages to negotiate better compensation.
👥 Cleaner Employment Trends
Total estimated jobs for Cleaners/Janitors
👥 Supervisor Employment Trends
Total estimated jobs for Supervisors
The Geography of Opportunity: Where Location Drives Earnings
A $8.16/hour gap separates the highest and lowest paying states—enough to mean $17,000 more per year
The gap between the highest- and lowest-paying states is $8.16/hour — roughly $17,000 more per year.
Massachusetts cleaners: $21.43/hour
Mississippi cleaners: $13.27/hour
But focusing only on current wages misses the bigger picture. Some lower-paying states are experiencing explosive growth:
Arizona: $17.37/hour, +6.9% annually
Idaho: $17.00/hour, +6.5% annually
New Mexico: $16.17/hour, +6.5% annually
For employers, this means rising costs are coming fast in these regions. For workers, these are the "sweet spot" states where pay is climbing quickly and hiring demand remains strong.
The Promotion Premium: Where Moving Up Pays Off Most
In some states, becoming a supervisor doubles your pay. In others, it barely moves the needle.
Becoming a supervisor can be a huge financial upgrade — but not everywhere.
Rhode Island supervisors earn 70% more than cleaners, a $12.25/hour bump that turns a $36K job into a $62K career.
Texas supervisors, meanwhile, see just a 22% pay increase, which often isn't enough to offset added responsibility.
For employers: In high-premium states like RI, UT, and HI, emphasizing career growth paths is a powerful recruitment tool.
In low-premium states, retention strategies need to focus on culture, flexibility, or competitive base pay instead.
National Pay Gap Over Time
Visualizing the percentage difference between supervisor and cleaner median wages from 2019 to 2024.
The janitorial industry is being reshaped by geographic wage gaps, shifting promotion incentives, and tightening labor pools.
For workers, it pays to follow wage growth hotspots like AZ, ID, and NM. Promotions are most valuable in high-premium states, while in low-premium states, switching employers often yields better pay than moving up internally.
For employers, plan ahead for rising labor costs in growth markets and consider exploring low-cost regions for expansion to offset wage pressure. Retention strategies now need to emphasize flexibility and culture as much as pay.
📊 National Pay Gap Time Series
% difference between Supervisor and Cleaner median wages
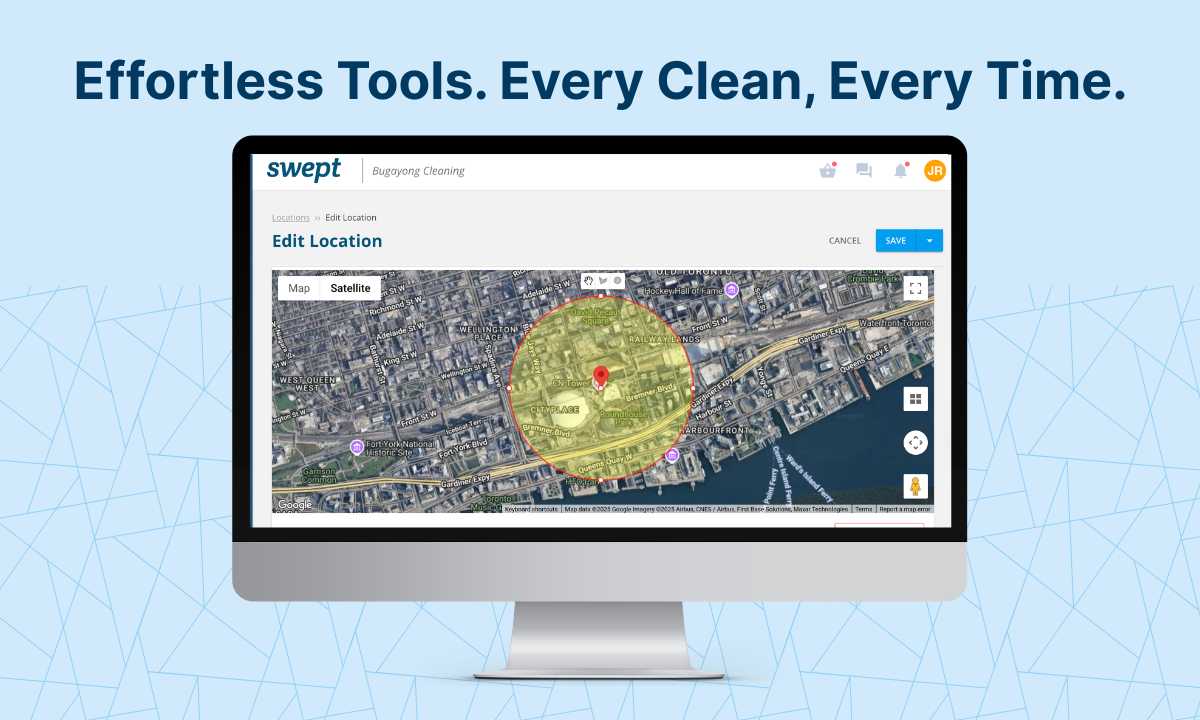
Turn Insights Into Action
Wages are shifting, expectations are rising, and the cleaning industry is evolving fast. The companies that succeed will be the ones that use this data to make smarter decisions, build stronger teams, and stay ahead of the competition.
Download the Full Report